Barriers to cycling
This page is a draft under construction. It is a widely editable wiki page and should not be assumed to be official Cycling Embassy policy.
There are a number of reasons why people chose modes other than a bicycle for journeys in the UK. However, the main barrier to cycling in this country is the perception that our roads are too dangerous and uncomfortable, largely due to high volumes and high speeds of motor traffic. This is the so-called "subjective safety" problem. While some people try to address this problem by explaining that the absolute risk of injury and death while cycling is very low, this approach somewhat misses the point. Safety is a problem of danger while subjective safety is a problem of fear: the causes and solutions to the two problems are not necessarily exactly aligned. A roller coaster ride, for example, shows that fear is not exactly the result of danger.
Those issues are explained in more detail in other sections of the website, and in our "canards" pages. The purpose of this page is to document the evidence on barriers to cycling, particularly subjective safety.
National Travel Survey, 2020 release
The National Travel Attitudes Survey (NTAS) found that 66% of adults over the age of 18 agreed that "it is too dangerous for me to cycle on the roads". The figure was even higher for women, at 71%.
Thornton et al, 2010
Thornton et al produced a report for the Department for Transport in July 2011, "Climate Change and Transport Choices". The report presented findings from a large survey of public attitudes relating to climate change and transport, the findings from which were published in an interim report and dataset in December 2010.
In the survey population, 90% were physically capable of cycling, and 92% had "learnt to cycle" at some point in their lives. Just over half of those capable of cycling actually owned or had access to a bicycle. 12% of the survey population used a bicycle at least once a week, and 25% at least once a year; however, use of a bicycle as a main mode of transport -- such as commuter and shopping journeys -- reached only 5%, even in the population of bicycle owners. (This is similar to the findings of the National Travel Survey.) Rate of cycling varied by age, sex, and location.
The survey population were asked whether they had considered making more journeys by bicycle. 62% had never considered, 24% had considered but rejected without trying, 6% had considered but rejected or lapsed after trying, 5% were considering but had yet to make a decision or try, and just 3% had successfully converted some travel to cycling. However, when presented with the statement "I'm not the kind of person who rides a bicycle", more than half disagreed, indicating that many more could make the switch if barriers to cycling were removed.
Those who are able to cycle were then asked to rate five statements about their feelings of safety and cycling. When presented with the statement "it's too dangerous for me to cycle on the roads", nearly two thirds agreed, with only a quarter actively disagreeing. Almost a half of the respondents said that they simply will not cycle on roads.
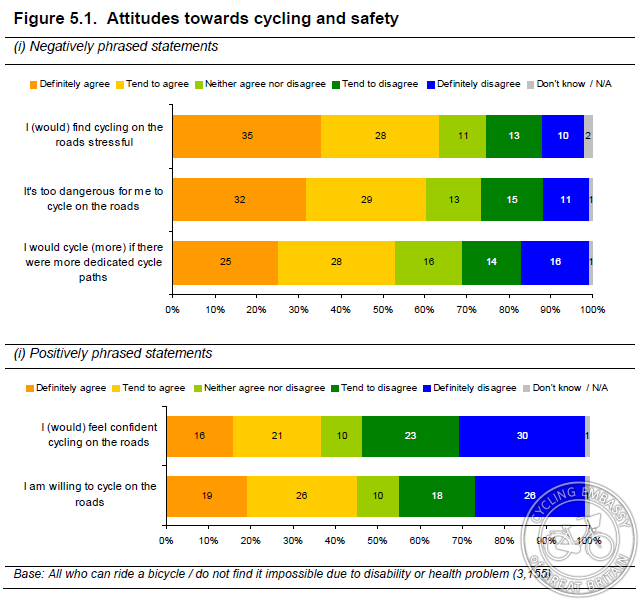
Agreement with the statement "it's too dangerous for me to cycle" rose with age, and was significantly higher from women, with almost three quarters of women agreeing to around half of men. The results applied equally to urban and rural dwellers.
DfT, 2013 - British Social Attitudes Survey
The British Social Attitudes Survey on 'Public Attitudes to Transport' found that 61% of respondents felt that it is too dangerous for them to cycle on the roads. This figure rose to 67% for 'non cyclists' (people who had not ridden a bike at least once in the previous 12 months) and fell to 48% for 'cyclists' (people who had ridden a bike at least once in the previous 12 months).

69% of women surveyed stated that it is too dangerous for them to cycle on the roads, compared to 53% of men. This difference held for 'cyclists' too - 55% of female cyclists stated it is too dangerous for them to cycle on the roads, compared to 43% of male cyclists.
The survey also found that age has a strong effect on willingness to cycle on British roads.

There was, however, no general antipathy to cycling in principle as a mode of transport - 40% of those surveyed agreed (or strongly agreed) that many of the journeys under 2 miles that they currently make by car could 'just as easily' be made by bike.
Basford et al, 2002 (DfT study)
A report for the Department for Transport (2002), entitled 'Drivers's perceptions of cyclists'. This report summarised previous attitude studies as follows -
The earlier attitudes work revealed that one of the main reasons for people dismissing cycling as a genuine form of transport was fear of actual and perceived road danger.
CTC et al, 1997
In 1997 a group from the Cyclists Touring Club, C-PAG and Southampton City Council sought to understand existing and potential cyclists' perspectives on cycling and barriers to cycling (PDF). They asked potential cyclists to rate a number of statements:
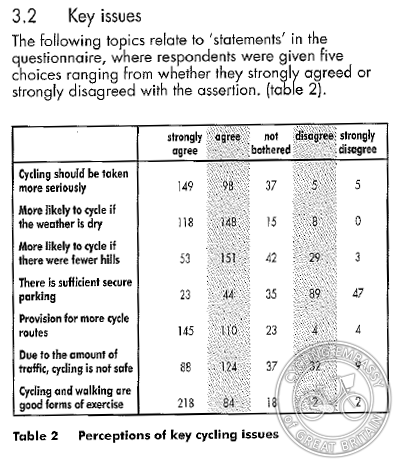
Hills and weather are also given as barriers to cycling; however these barriers are localised, affecting only a minority of journeys, and only the subjective safety barrier explains the more general trend of low cycling rates.
Transport for Greater Manchester, 2011
A TfGM online survey open to all participants and publicised through TfGM's online channels received 490 responses. Most questions were concerned with secure cycle parking, but one asked specifically what the barriers to cycling in Greater Manchester are:
Sustrans survey, 2012
A survey carried out by Sustrans in 2012 found that the majority of British people (56%) felt urban roads were unsafe to cycle on.
However, the same survey found that sixty five per cent of those that don't cycle regularly would be more likely to cycle on the roads if they were made safer through changes like lower speed limits, more marked cycle lanes and more care taken by drivers and other cyclists.
YouGov survey commissioned by Ofo (dockless bike share company), 2017
Over two-thirds of Brits that have learnt to ride a bike say the biggest barrier to cycling for work purposes is feeling unsafe on the roads.
TfL, 2010
A 2010 Transport for London study, 'Analysis of Cycling Potential', found that 'safety, traffic and lack of facilities are the greatest barriers' to uptake amongst existing infrequent cyclists, and also that
For all groups, including frequent cyclists, safety was the most significant barrier to cycling in general and for specific trips. This suggests that, in order to realise the remaining potential from existing frequent cyclists, practical measures to increase safety and improve the provision of facilities will be the most effective.
TfL, 2014
These findings were again confirmed by a TfL report from 2014, Attitudes to Cycling. This study found that
Safety concerns remain the key deterrent to cycling, far more so than concerns about lack of fitness or cycling ability
with 80% of those surveyed ranking safety as their number one barrier.
Safety was also cited as the main reason why respondents were cycling less, and also as the main barrier to cycling to school more often. Even amongst those who were already cycling, safety was the number one reason for not cycling more, with 'no significant difference' in attitude between regular and occasional cyclists.

These findings were repeated in TfL's 2015 survey.
Ryley, T., 2004
A study of Edinburgh households and their attitudes to cycling, entitled Identifying the Population Segments Most Likely to Cycle. Ryley conducted extensive travel behaviour surveys with 997 households in West Edinburgh. The survey found that off-road cycle lanes were more popular than those on-road, and 53% respondents agreed “safety fears of traffic prevent them from cycling more often in Edinburgh".
Pooley et al, 2011
The Understanding Walking and Cycling Report was a major study undertaken over three years by a project team of academics from Lancaster University, Oxford Brookes University, and the University of Leeds. It found three major barriers to cycling (and walking) - safety concerns; difficulty of fitting walking and cycling into household routines; and abnormality.
While the report discovered that 'attitudes to walking and cycling are mostly positive or neutral' amongst the general population, many people who would like to walk and cycle more fail to do so for a combination of these reasons. In particular, the study found
a number of negative associations with cycling, including the need to negotiate difficult road junctions, cycling being a bad experience using existing roads and desire for more cycle lanes to feel safer, which together indicate notable safety concerns. Indeed poor safety was one of the key reasons for not cycling expressed by approximately 80% of respondents
Further
it is clear that traffic is a major deterrent for all but the most committed cyclists. Potential cyclists, recreational (off-road) cyclists and occasional cyclists are dis- couraged from using their bicycles for everyday urban journeys because of their fear of cars and heavy goods vehicles
Three TRL reports:
Davies et al (1997)
A TRL report entitled Attitudes to cycling: a qualitative study and conceptual framework.
According to the majority of respondents, the most important factor contributing to non-cycle use, other than car dependence, was the fear of danger from motor vehicles. Driver behaviour and traffic speed were cited as the most dangerous factors. This fear was often expressed as cyclists’ general vulnerability to a number of factors, including weather, embarrassment and fumes as well as danger. It was difficult to disentangle concerns about danger (the risk of being injured) from more general feelings of the unpleasantness of cycling in the noise, fumes and stress of busy traffic.
Pearce at al (1998)
A TRL report entitled Cycling for a healthier nation.
Despite any health gains to be obtained from cycling, the fear of traffic will remain as one of the biggest barriers to encouraging more people to benefit from reduced illness.
Gardner (1998)
A TRL report entitled Transport implications of leisure cycling.
The main barrier to more utility cycling by leisure cyclists is their fear of traffic.
'Traffic' features as the most prominent 'dislike' about cycling in this survey of leisure cyclists.

Brake survey, 2012
A survey of 1,550 commuters by road safety charity Brake found that two-thirds of people think UK roads are not safe enough for cycling. The same survey also found that 35% of commuters would switch to cycling if roads were less dangerous.
Brake survey, 2015
A 2015 survey of 1,301 11-17 year olds in secondary education and colleges. It found that 'almost half (47%) said parental worries were preventing them from starting cycling or cycling more.'
BBC Survey, 2014
A 2014 survey conducted for the BBC by ComRes found that 52 per cent agree with the statement that it is “too dangerous to cycle on the roads in my local area”. The poll also revealed that older Britons were more likely than their younger counterparts to believe the roads were too dangerous: 61% of those aged 65 and over, compared to 45% of 18 to 24 year olds.
Only 34 per cent thought that their local roads were well designed for cycling.
London Cycling Campaign Survey, 2014
A survey conducted on Twitter and Facebook by the London Cycling Campaign found that 73% of respondents who do not regularly cycle would cycle during a Tube strike "if there was less danger from motor traffic."
Northern Ireland Executive, 2014
A 2014 survey carried out by Northern Ireland's Department for Regional Development asked respondents what would discourage them from cycling for short trips of under 3 miles, from a list of options. 42% of respondents did not have access to a bicycle. 28% chose 'traffic/danger' as their main reason for not cycling for short trips; 22% chose 'poor cycling infrastructure'; 19% chose 'inconsiderate car drivers'.
In total, therefore, 69% of respondents felt that hostile conditions - either in the form of traffic danger, or poor infrastructure - were their main barrier to cycling for short trips.

More analysis on the NI Greenways blog, including the percentage changes from the previous survey in 2011 -

Winters & Teschke, 2010
A study of cycling potential in Vancouver, examining in particular the design preferences of the 'near market' for cycling. Respondents showed a strong preference for physical separation from motor traffic, as shown in the graph, below.

Sanders, 2016
Study in the San Francisco area which showed that both people cycling and people driving reported greater comfort with separation of these two modes.
both drivers and bicyclists are more comfortable on roadways with separated bicycling facilities than those with shared space. In particular, roadways with barrier-separated bicycle lanes were the most popular among all groups, regardless of bicycling frequency. Striped bicycle lanes, a common treatment in the United States, received mixed reviews
Aldred et al, 2016
A systematic literature review of stated preferences for cycling infrastructure types, examining whether those preferences vary by age and gender.
Differences in preferences were quantitative rather than qualitative; that is, preferences for separated infrastructure were stronger in some groups than in others, but no group preferred integration with motor traffic. Thus, in low-cycling countries seeking to increase cycling, this evidence suggests focusing on the stronger preferences of under-represented groups as a necessary element of universal design for cycling.
Mertens et al., 2016
A study of environmental preferences (i.e. desired cycling infrastructure types) for transport cycling amongst adults. The most decisive intervention was physical separation by means of protected cycleway.
... results indicated that cycle path type (i.e. a good separated cycle path) is the most important environmental factor for all participants and certainly for individuals who did not cycle for transport. Furthermore, only negligible differences were found between the importances of the other micro-environmental factors (i.e. traffic density, evenness of the cycle path, maintenance, vegetation and speed limits) regarding the two at risk subgroups and that providing a speed bump obviously has the least impact on the street’s appeal to cycle for transport.
To add -
- Dave Horton summary of evidence http://thinkingaboutcycling.com/article-fear-of-cycling/
- also references at http://thinkingaboutcycling.com/2014/01/07/different-worlds/
- Aldred on stated and revealed preferences - 'A broad academic consensus that most people prefer to cycle away from motor traffic, or in environments with low levels of motor traffic (Aldred 2015:EJTIR)
- Sustrans 2019 Bike Life report: https://www.sustrans.org.uk/bike-life
- Lauren Pearson, Danielle Berkovic, Sandy Reeder, Belinda Gabbe & Ben Beck (2022) Adults’ self-reported barriers and enablers to riding a bike for transport: a systematic review, Transport Reviews, DOI: 10.1080/01441647.2022.2113570
- https://road.cc/content/news/251091-survey-dangerous-roads-deter-one-four-commuting-bike
More like this
Donate
CEoGB is a volunteer-run organisation, funded entirely from voluntary donations.
Embassy News
Tuesday 30th June 2020
Wednesday 15th May 2019
Monday 11th June 2018